
DATA OVERVIEW
The link provided below displays each tests’ charge time, run time, and recharge time.
A percentage comparison of the two distribution method (parallel and series) is also provided in the 13th column of the spreadsheet. This result is taken by calculating the percentage difference of the elapsed time between both distribution method.
Link : Accumulator-Data-Analysis-Overview
Test Summary:
| Test 1: Parallel – All Branches | Test 6: Series – All Branches |
| Test 2: Parallel – Festo-Bimba + Air Gun | Test 7: Series – Festo-Bimba + Air Gun |
| Test 3: Parallel – Festo-Bimba + Valve | Test 8: Series – Festo-Bimba + Valve |
| Test 4: Parallel – Festo-Bimba | Test 9: Series – Festo-Bimba |
| Test 5: Parallel – Valve/Air Gun | Test 10: Series – Valve/Air Gun |
IMR TEST RESULTS
IMR Charts were created to ensure that all tests conducted with the Automation Studio program are deemed stable and usable. The charts of each test are linked below in the table.
| IMR Test 1 | IMR Test 6 |
| IMR Test 2 | IMR Test 7 |
| IMR Test 3 | IMR Test 8 |
| IMR Test 4 | IMR Test 9 |
| IMR Test 5 | IMR Test 10 |
OVERALL PEAK DATA RESULTS
Parallel vs Series – All Branches in Use
The graphs below displays the comparison times between Test 1 and Test 6 -peak operating conditions include all devices (pistons, valve, and air gun) will be in use. ‘charge up time’ is described to be the amount of time it takes for the air tank (accumulator) to reach the set pressure intake (40 psi) before releasing into the system:
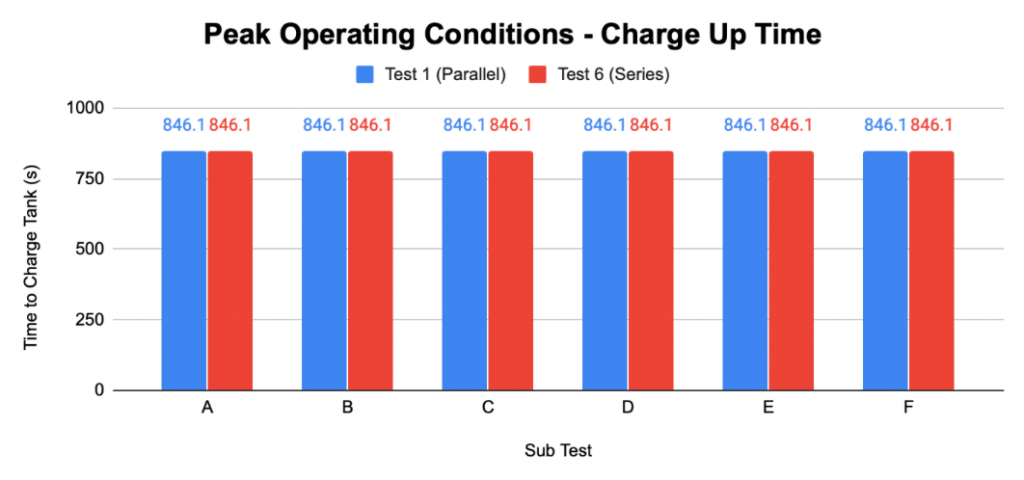
As shown above, whether the system runs at a parallel or series distribution method, the charge up time remains to be 846.1 seconds.
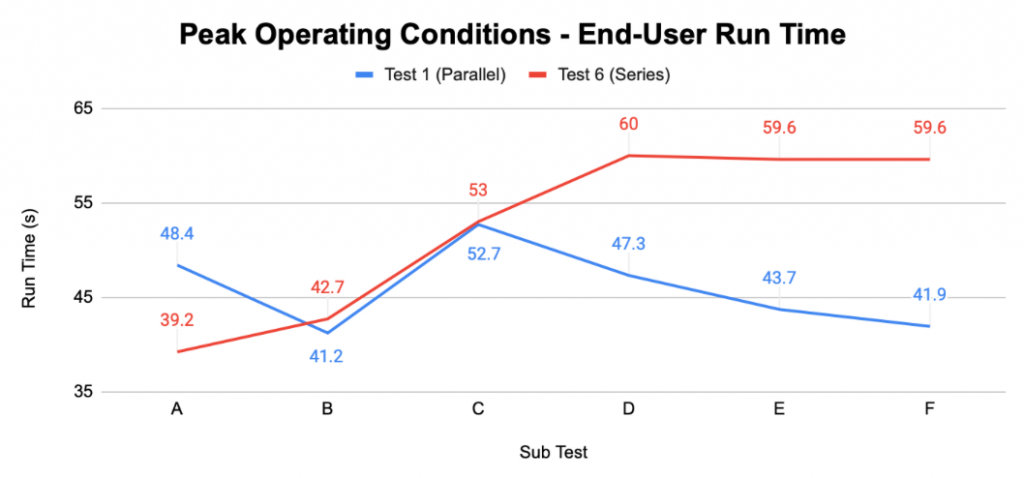
The ‘run time’ indicates the production time once compressed air and pressure is released from the accumulator into the system, which then drives all end user devices. With all devices running, including three cycles of 10 second bursts from the air gun, it is shown that pressure and compressed air is distributed to end user devices quicker through a parallel loop than a series run in sub tests D, E, and F where the orifice sizes of the end user devices are small.
To further explain the previous graph, A-F represent sub test configurations:
| Sub Test | Piston | Air Gun | Valve | |
| A | Festo-Bimba | 0.25″ | 0.25″ | |
| B | Festo-Bimba | 0.25″ | 0.125″ | |
| C | Festo-Bimba | 0.25″ | 0.0625″ | |
| D | Festo-Bimba | 0.125″ | 0.25″ | |
| E | Festo-Bimba | 0.125″ | 0.125″ | |
| F | Festo-Bimba | 0.125″ | 0.0625″ |
‘Recharge time’ is the process in which all end user devices have ceased usage and the accumulator is set to reach the set pressure once again. In the graph shown below, a parallel distribution is favored for sub tests A, D, and E. While sub tests B and F are favored in a series run.
